
Analytics
Designing a 0-1, 360° security insights analytics platform
a 0-1 onboarding configuration platform design.
Analytics
Designing a 0-1, 360° security insights analytics platform
a 0-1 onboarding configuration platform design.
Analytics
Designing a 0-1, 360° security insights analytics platform
a 0-1 onboarding configuration platform design.
Company context
Ambient.ai analyzes camera footage to filter out irrelevant content, allowing security professionals to focus on critical incidents.
Enterprise SaaS, Physical Security, Computer Vision

Company context
Ambient.ai analyzes camera footage to filter out irrelevant content, allowing security professionals to focus on critical incidents.
Enterprise SaaS, Physical Security, Computer Vision
Company context
Ambient.ai analyzes camera footage to filter out irrelevant content, allowing security professionals to focus on critical incidents.
Enterprise SaaS, Physical Security, Computer Vision
Project overview
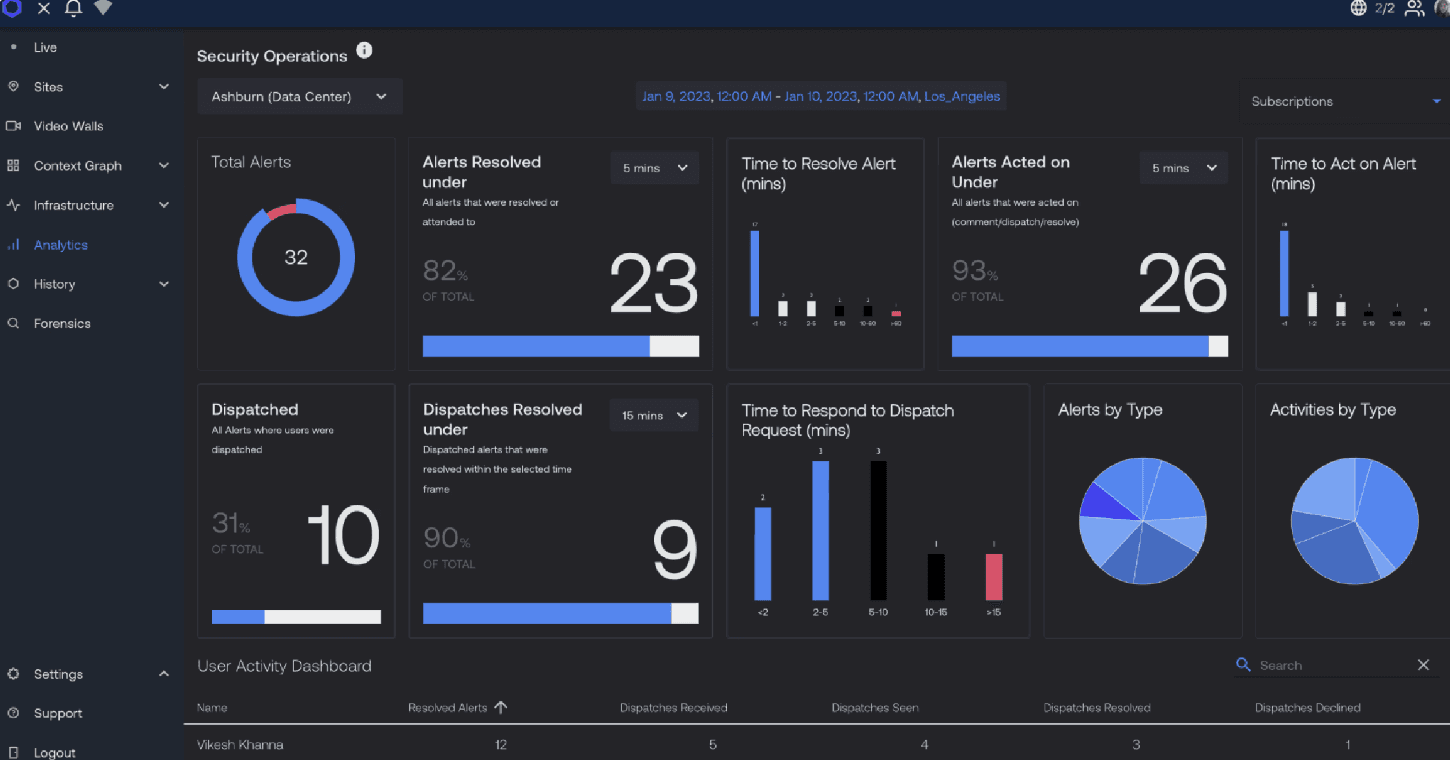
I designed a 0-1 analytics experience enabling customers to create, and track relevant metrics within dashboards directly in the product platform.
RESULTS
Retained 7 key accounts, reduced support tickets by 20%, increased dashboard engagement by 31%.
RESULTS
Retained 7 key accounts, reduced support tickets by 20%, increased dashboard engagement by 31%.
RESULTS
Retained 7 key accounts, reduced support tickets by 20%, increased dashboard engagement by 31%.
TEAM SIZE
8
TEAM SIZE
8
TEAM SIZE
8
TIMELINE
4 months
TIMELINE
4 months
TIMELINE
4 months
Problem context

Data is limited, and charts are un-customizable.

Visualizations are lackluster.
Design objective
Currently, analytics is limited in metrics and customization.
Currently, analytics is limited in metrics and customization.
Currently, analytics is limited in metrics and customization.
Forcing security professionals to rely on external tools like PowerBI for insights on making data-driven decisoins.
Forcing security professionals to rely on external tools like PowerBI for insights on making data-driven decisoins.
Forcing security professionals to rely on external tools like PowerBI for insights on making data-driven decisoins.
A single dashboard analytics product experience.
A single dashboard analytics product experience.
A single dashboard analytics product experience.
OBJECTIVE
Design an analytics platform that enables customers to effectively report on alerts, staffing, camera, and access control metrics.
OBJECTIVE
Design an analytics platform that enables customers to effectively report on alerts, staffing, camera, and access control metrics.
OBJECTIVE
Design an analytics platform that enables customers to effectively report on alerts, staffing, camera, and access control metrics.
The design process
Key Phases
1
Design foundational create dashboards & chart workflows.
Design foundational create dashboards & chart workflows.
Design foundational create dashboards & chart workflows.
2
Deliver the right metrics.
Deliver the right metrics.
Deliver the right metrics.
3
Improve visualizations
Improve visualizations
Improve visualizations
Iteration Highlights
Usability improvements on the MVP
Usability improvements on the MVP
Usability improvements on the MVP

Before

After
Improving chart usability
Improving chart usability
Improving chart usability
Before
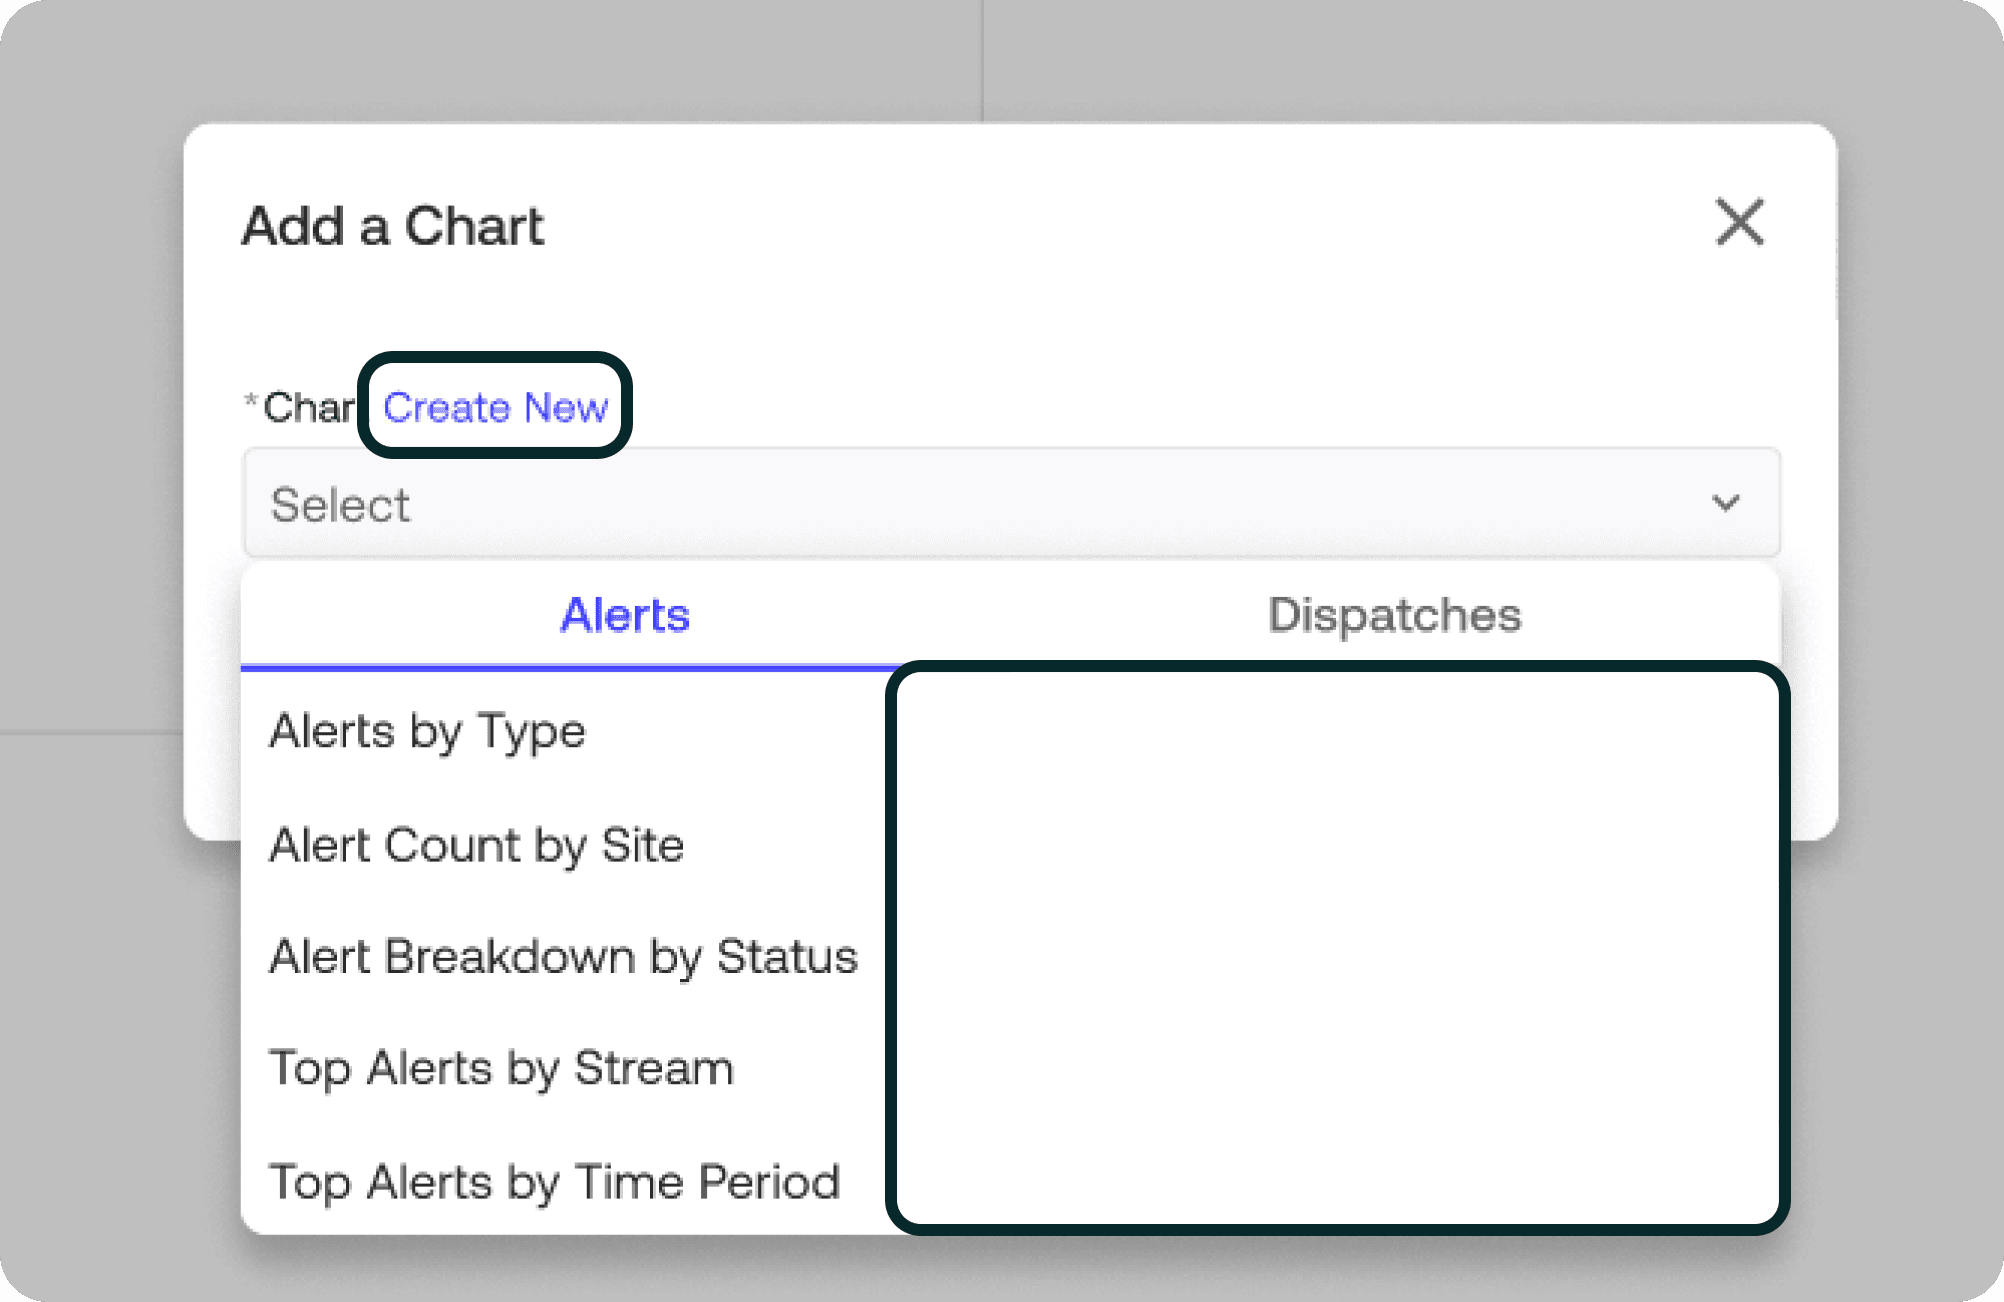
Customers have a desire to create custom charts more frequently than anticipated.
Customers have a desire to create custom charts more frequently than anticipated.
Customers have a desire to create custom charts more frequently than anticipated.
Customers would like to preview charts before adding them to a dashboard.
Customers would like to preview charts before adding them to a dashboard.
Customers would like to preview charts before adding them to a dashboard.

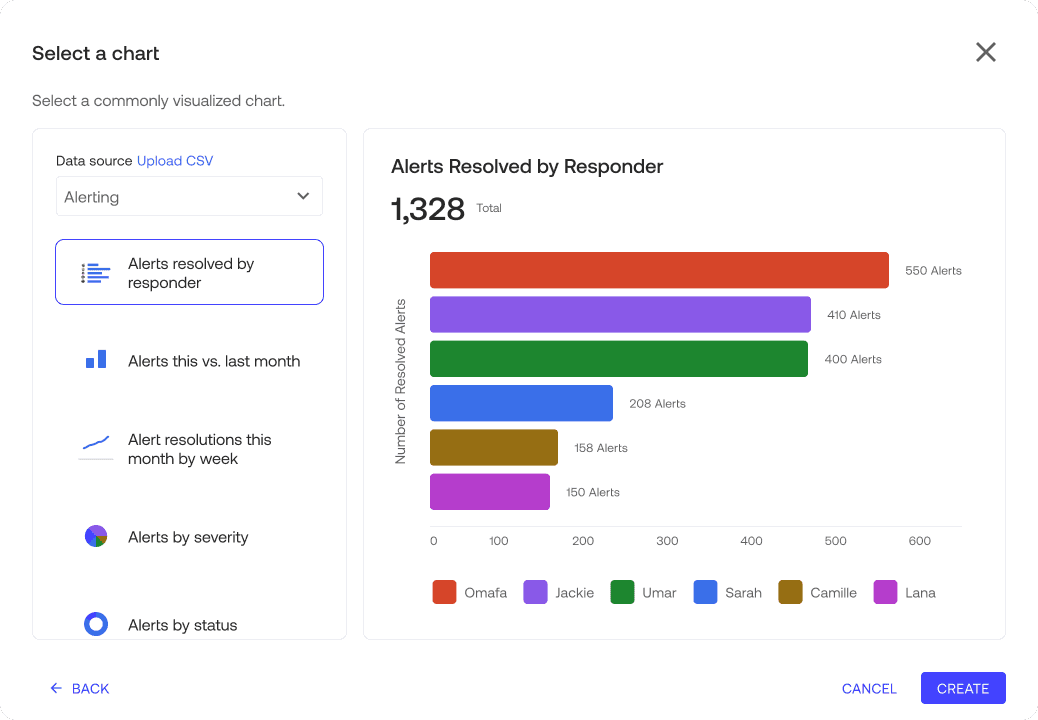
After
Improving chart visualizations & dashboard legibility
Improving chart visualizations & dashboard legibility
Improving chart visualizations & dashboard legibility

Before

After
A new set of chart components in both light & dark mode.
A new set of chart components in both light & dark mode.
A new set of chart components in light & dark mode.
Design solution

An end-to-end custom chart and dashboard creation experience with presentation ready visualizations.
Design solution
An end-to-end custom chart and dashboard creation experience with presentation ready visualizations.
Design solution
An end-to-end custom chart and dashboard creation experience with presentation ready visualizations.
Impact